
Chapter 13
Aviation Weather Services
Winds and Temperature Aloft Forecast (FB)
Winds and temperatures aloft forecasts (FB) provide wind and temperature forecasts for specific locations throughout the United States, including network locations in Hawaii and Alaska. The forecasts are made twice a day based on the radiosonde upper air observations taken at 0000Z and 1200Z.
Altitudes through 12,000 feet are classified as true altitudes, while altitudes 18,000 feet and above are classified as altitudes and are termed flight levels. Wind direction is always in reference to true north, and wind speed is given in knots. The temperature is given in degrees Celsius. No winds are forecast when a given level is within 1,500 feet of the station elevation. Similarly, temperatures are not forecast for any station within 2,500 feet of the station elevation.
If the wind speed is forecast to be greater than 99 knots but less than 199 knots, the computer adds 50 to the direction and subtracts 100 from the speed. To decode this type of data group, the reverse must be accomplished. For example, when the data appears as “731960,” subtract 50 from the 73 and add 100 to the 19, and the wind would be 230° at 119 knots with a temperature of -60 °C. If the wind speed is forecast to be 200 knots or greater, the wind group is coded as 99 knots. For example, when the data appears as “7799,” subtract 50 from 77 and add 100 to 99, and the wind is 270° at 199 knots or greater. When the forecast wind speed is calm, or less than 5 knots, the data group is coded “9900,” which means light and variable. [Figure 13-9]
Explanation of Figure 13-9: The heading indicates that this FB was transmitted on the 15th of the month at 1640Z and is based on the 1200Z upper air data. The valid time is 1800Z on the same day and should be used for the period between 1400Z and 2100Z. The heading also indicates that the temperatures above FL240 are negative. Therefore, the minus sign will be omitted for all forecast temperatures above FL240.
A four-digit data group shows the wind direction in reference to true north and the wind speed in knots. The elevation at Amarillo, Texas (AMA) is 3,605 feet, so the lowest reportable
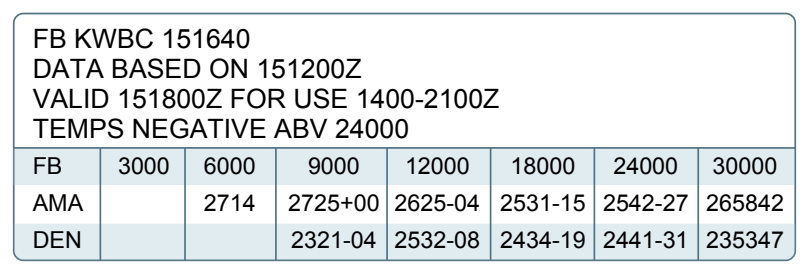
altitude is 6,000 feet for the forecast winds. In this case, “2714” means the wind is forecast to be from 270° at a speed of 14 knots.
A six-digit group includes the forecast temperature aloft. The elevation at Denver (DEN) is 5,431 feet, so the lowest reportable altitude is 9,000 feet for the winds and temperature forecast. In this case, “2321-04” indicates the wind is forecast to be from 230° at a speed of 21 knots with a temperature of -4 °C.
Weather Charts
Weather charts are graphic charts that depict current or forecast weather. They provide an overall picture of the United States and should be used in the beginning stages of flight planning. Typically, weather charts show the movement of major weather systems and fronts. Surface analysis, weather depiction, and significant weather prognostic charts are sources of current weather information. Significant weather prognostic charts provide an overall forecast weather picture.
Surface Analysis Chart
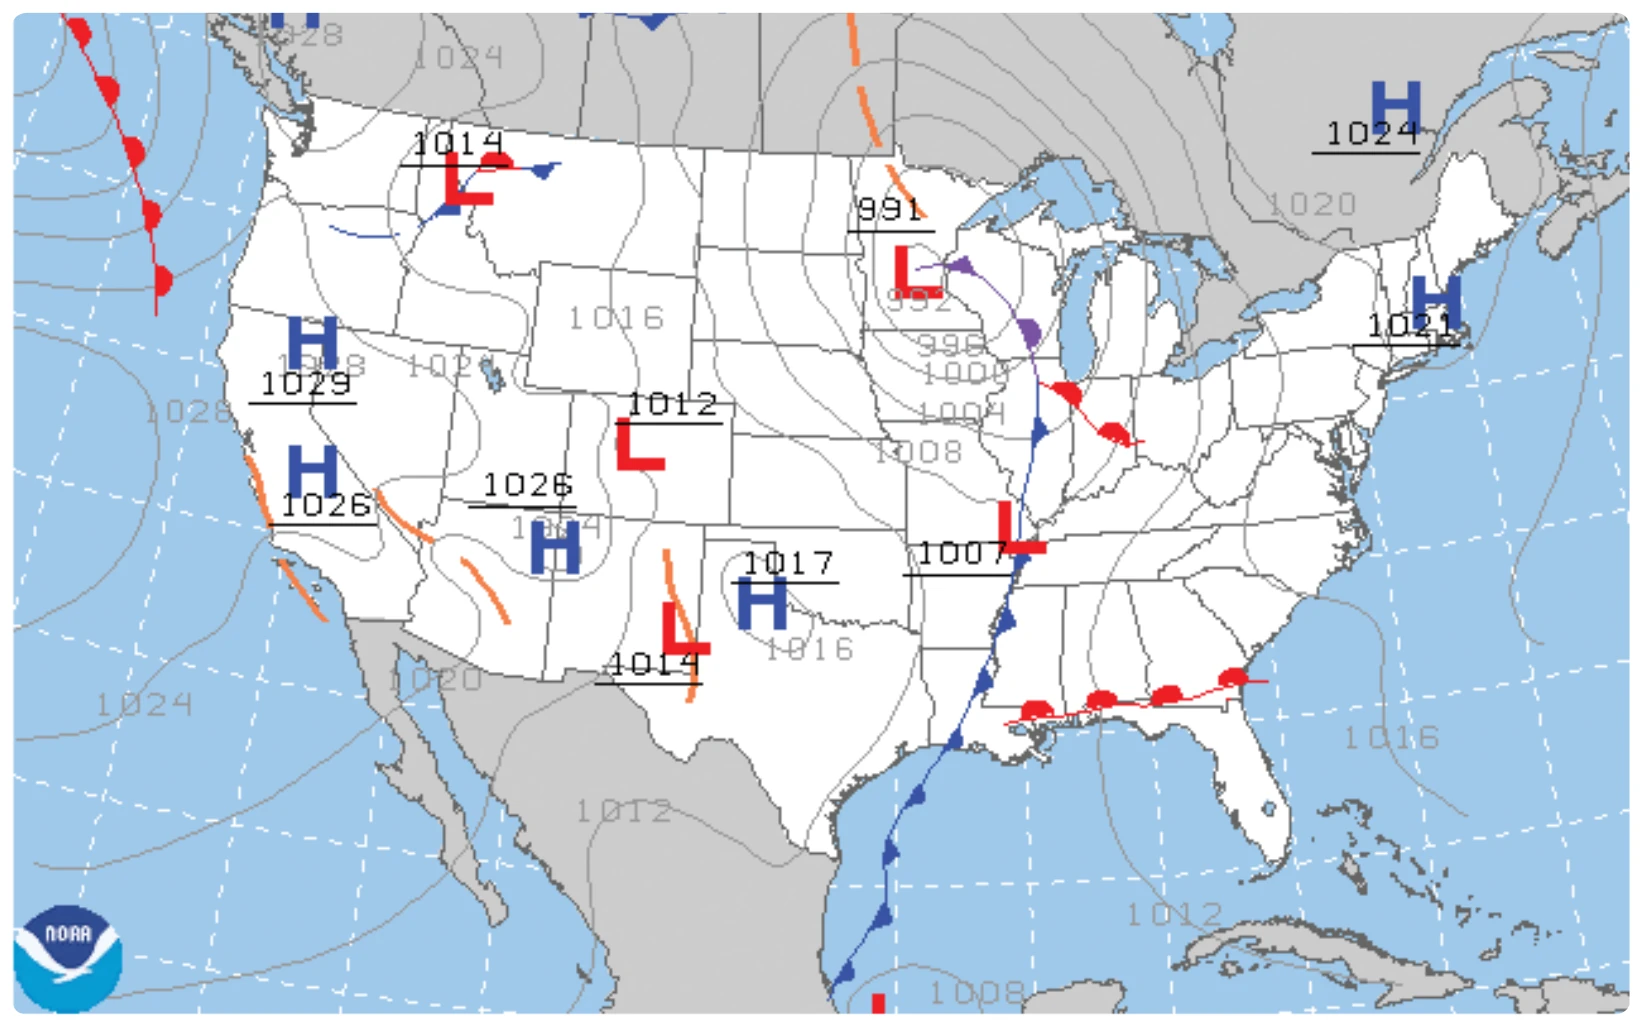
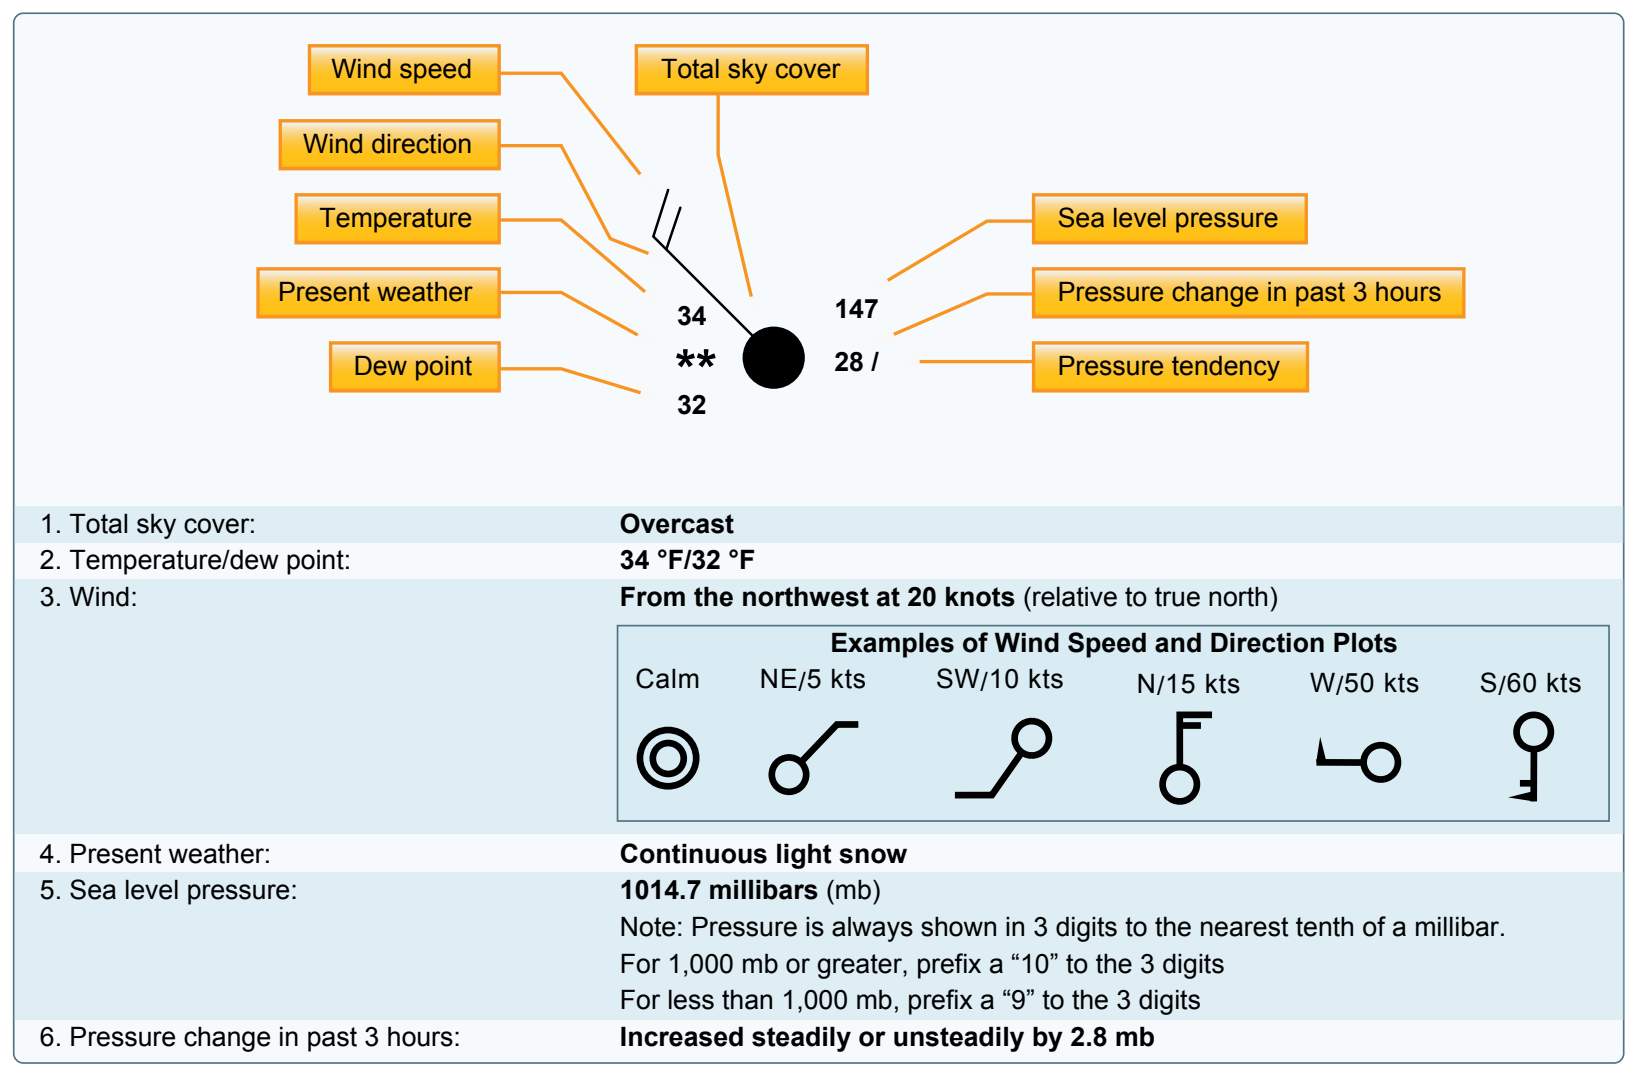
The surface analysis chart depicts an analysis of the current surface weather. [Figure 13-10] This chart is transmitted every 3 hours and covers the contiguous 48 states and adjacent areas. A surface analysis chart shows the areas of high and low pressure, fronts, temperatures, dew points, wind directions and speeds, local weather, and visual obstructions. Surface weather observations for reporting points across the United States are also depicted on this chart. Each of these reporting points is illustrated by a station model. [Figure 13-11] A station model includes:
- Sky cover-the station model depicts total sky cover and is shown as clear, scattered, broken, overcast, or obscured/partially obscured.
- Sea level pressure-given in three digits to the nearest tenth of a millibar (mb). For 1,000 mbs or greater, prefix a 10 to the three digits. For less than 1,000 mbs, prefix a 9 to the three digits.
- Pressure change/tendency-pressure change in tenths of mb over the past 3 hours. This is depicted directly below the sea level pressure.
- Dew point-given in degrees Fahrenheit.
- Present weather-over 100 different standard weather symbols are used to describe the current weather.
- Temperature-given in degrees Fahrenheit.
- Wind-true direction of wind is given by the wind pointer line, indicating the direction from which the wind is blowing. A short barb is equal to 5 knots of wind, a long barb is equal to 10 knots of wind, and a pennant is equal to 50 knots.
Weather Depiction Chart
A weather depiction chart details surface conditions as derived from METAR and other surface observations. The weather depiction chart is prepared and transmitted by computer every 3 hours beginning at 0100Z time and is valid data for the forecast period. It is designed to be used for flight planning by giving an overall picture of the weather across the United States. [Figure 13-12]
The weather depiction chart also provides a graphic display of IFR, VFR, and marginal VFR (MVFR) weather. Areas of IFR conditions (ceilings less than 1,000 feet and visibility less than three miles) are shown by a hatched area outlined by a smooth line. MVFR regions (ceilings 1,000 to 3,000 feet, visibility 3 to 5 miles) are shown by a nonhatched area outlined by a smooth line. Areas of VFR (no ceiling or ceiling greater than 3,000 feet and visibility greater than five miles) are not outlined. Also plotted are fronts, troughs, and squall lines from the previous hours surface analysis chart.
Weather depiction charts show a modified station model that provides sky conditions in the form of total sky cover, ceiling height, weather, and obstructions to visibility, but does not include winds or pressure readings like the surface analysis chart. A bracket (] ) symbol to the right of the station indicates the observation was made by an automated station.