
Chapter 5
Aerodynamics of Flight
The smoothest pull-up possible, with a moderate load factor, delivers the greatest gain in altitude in a chandelle and results in a better overall performance in both chandelles and lazy eights. The recommended entry speed for these maneuvers is generally near the manufacturer’s design maneuvering speed, which allows maximum development of load factors without exceeding the load limits.
Rough Air
All standard certificated aircraft are designed to withstand loads imposed by gusts of considerable intensity. Gust load factors increase with increasing airspeed, and the strength used for design purposes usually corresponds to the highest level flight speed. In extremely rough air, as in thunderstorms or frontal conditions, it is wise to reduce the speed to the design maneuvering speed. Regardless of the speed held, there may be gusts that can produce loads that exceed the load limits.
Each specific aircraft is designed with a specific G loading that can be imposed on the aircraft without causing structural damage. There are two types of load factors factored into aircraft design: limit load and ultimate load. The limit load is a force applied to an aircraft that causes a bending of the aircraft structure that does not return to the original shape. The ultimate load is the load factor applied to the aircraft beyond the limit load and at which point the aircraft material experiences structural failure (breakage). Load factors lower than the limit load can be sustained without compromising the integrity of the aircraft structure.
Speeds up to, but not exceeding, the maneuvering speed allow an aircraft to stall prior to experiencing an increase in load factor that would exceed the limit load of the aircraft.
Most AFM/POH now include turbulent air penetration information, which help today’s pilots safely fly aircraft capable of a wide range of speeds and altitudes. It is important for the pilot to remember that the maximum “never-exceed” placard dive speeds are determined for smooth air only. High speed dives or acrobatics involving speed above the known maneuvering speed should never be practiced in rough or turbulent air.
Vg Diagram
The flight operating strength of an aircraft is presented on a graph whose vertical scale is based on load factor. [Figure 5-55] The diagram is called a Vg diagram—velocity versus G loads or load factor. Each aircraft has its own Vg diagram that is valid at a certain weight and altitude.
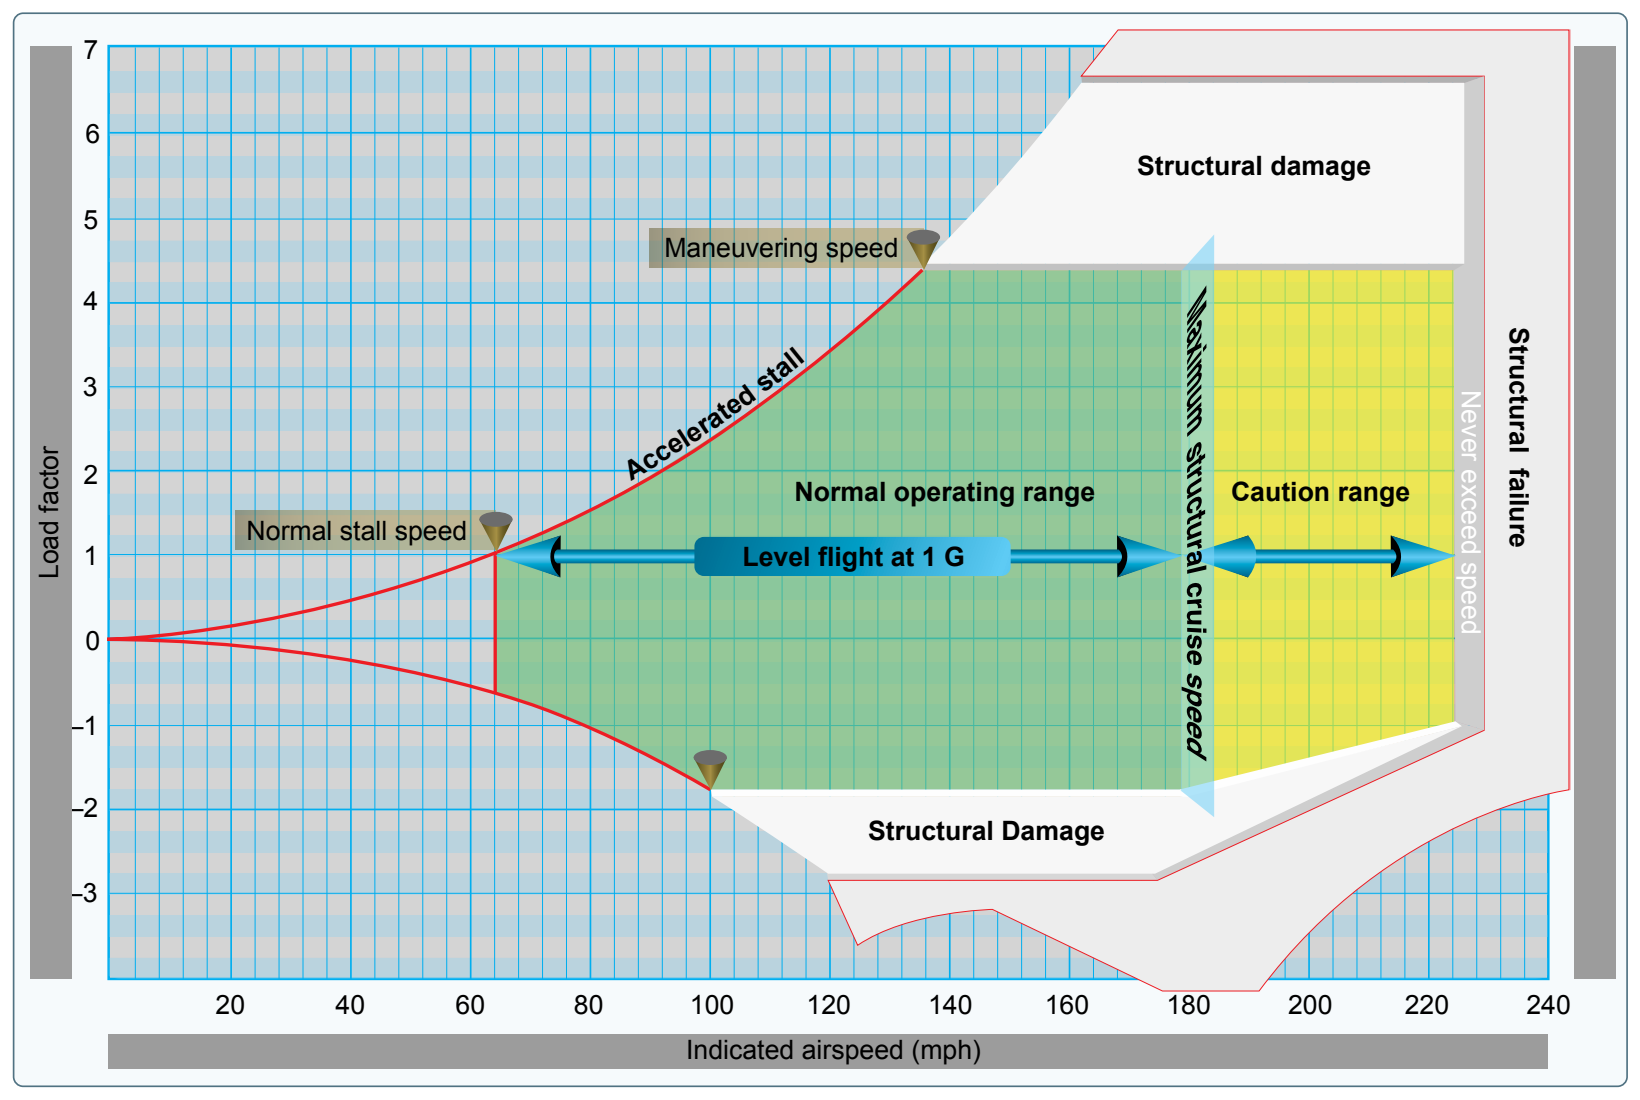
The lines of maximum lift capability (curved lines) are the first items of importance on the Vg diagram. The aircraft in Figure 5-53 is capable of developing no more than +1 G at 64 mph, the wing level stall speed of the aircraft. Since the maximum load factor varies with the square of the airspeed, the maximum positive lift capability of this aircraft is 2 G at 92 mph, 3 G at 112 mph, 4.4 G at 137 mph, and so forth. Any load factor above this line is unavailable aerodynamically (i.e., the aircraft cannot fly above the line of maximum lift capability because it stalls). The same situation exists for negative lift flight with the exception that the speed necessary to produce a given negative load factor is higher than that to produce the same positive load factor.
If the aircraft is flown at a positive load factor greater than the positive limit load factor of 4.4, structural damage is possible. When the aircraft is operated in this region, objectionable permanent deformation of the primary structure may take place and a high rate of fatigue damage is incurred. Operation above the limit load factor must be avoided in normal operation.
There are two other points of importance on the Vg diagram. One point is the intersection of the positive limit load factor and the line of maximum positive lift capability. The airspeed at this point is the minimum airspeed at which the limit load can be developed aerodynamically. Any airspeed greater than this provides a positive lift capability sufficient to damage the aircraft. Conversely, any airspeed less than this does not provide positive lift capability sufficient to cause damage from excessive flight loads. The usual term given to this speed is “maneuvering speed,” since consideration of subsonic aerodynamics would predict minimum usable turn radius or maneuverability to occur at this condition. The maneuver speed is a valuable reference point, since an aircraft operating below this point cannot produce a damaging positive flight load. Any combination of maneuver and gust cannot create damage due to excess airload when the aircraft is below the maneuver speed.
The other point of importance on the Vg diagram is the intersection of the negative limit load factor and line of maximum negative lift capability. Any airspeed greater than this provides a negative lift capability sufficient to damage the aircraft; any airspeed less than this does not provide negative lift capability sufficient to damage the aircraft from excessive flight loads.
The limit airspeed (or redline speed) is a design reference point for the aircraft—this aircraft is limited to 225 mph. If flight is attempted beyond the limit airspeed, structural damage or structural failure may result from a variety of phenomena.
The aircraft in flight is limited to a regime of airspeeds and Gs that do not exceed the limit (or redline) speed, do not exceed the limit load factor, and cannot exceed the maximum lift capability. The aircraft must be operated within this “envelope” to prevent structural damage and ensure the anticipated service lift of the aircraft is obtained. The pilot must appreciate the Vg diagram as describing the allowable combination of airspeeds and load factors for safe operation. Any maneuver, gust, or gust plus maneuver outside the structural envelope can cause structural damage and effectively shorten the service life of the aircraft.
Rate of Turn
The rate of turn (ROT) is the number of degrees (expressed in degrees per second) of heading change that an aircraft makes. The ROT can be determined by taking the constant of 1,091, multiplying it by the tangent of any bank angle and dividing that product by a given airspeed in knots as illustrated in Figure 5-55. If the airspeed is increased and the ROT desired is to be constant, the angle of bank must be increased, otherwise, the ROT decreases. Likewise, if the airspeed is held constant, an aircraft’s ROT increases if the bank angle is increased. The formula in Figures 5-56 through 5-58 depicts the relationship between bank angle and airspeed as they affect the ROT.
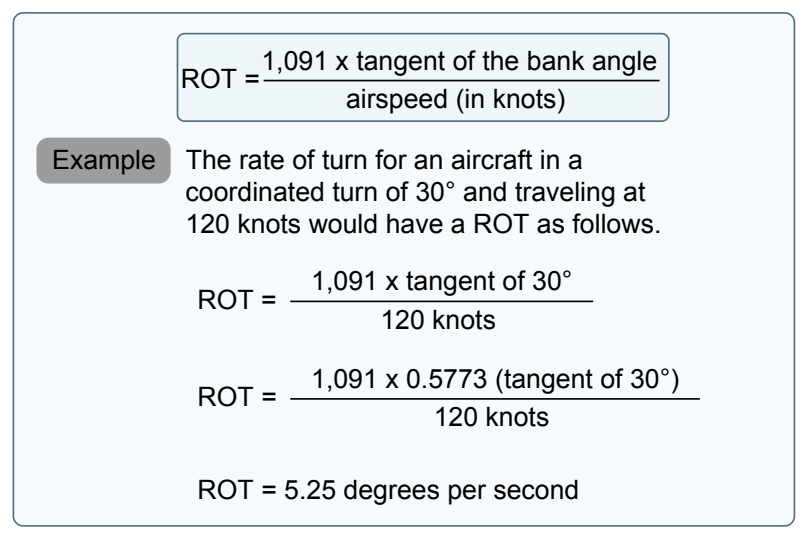
Airspeed significantly effects an aircraft’s ROT. If airspeed is increased, the ROT is reduced if using the same angle of bank used at the lower speed. Therefore, if airspeed is increased as illustrated in Figure 5-57, it can be inferred that the angle of bank must be increased in order to achieve the same ROT achieved in Figure 5-58.