
Chapter 11
Aircraft Performance
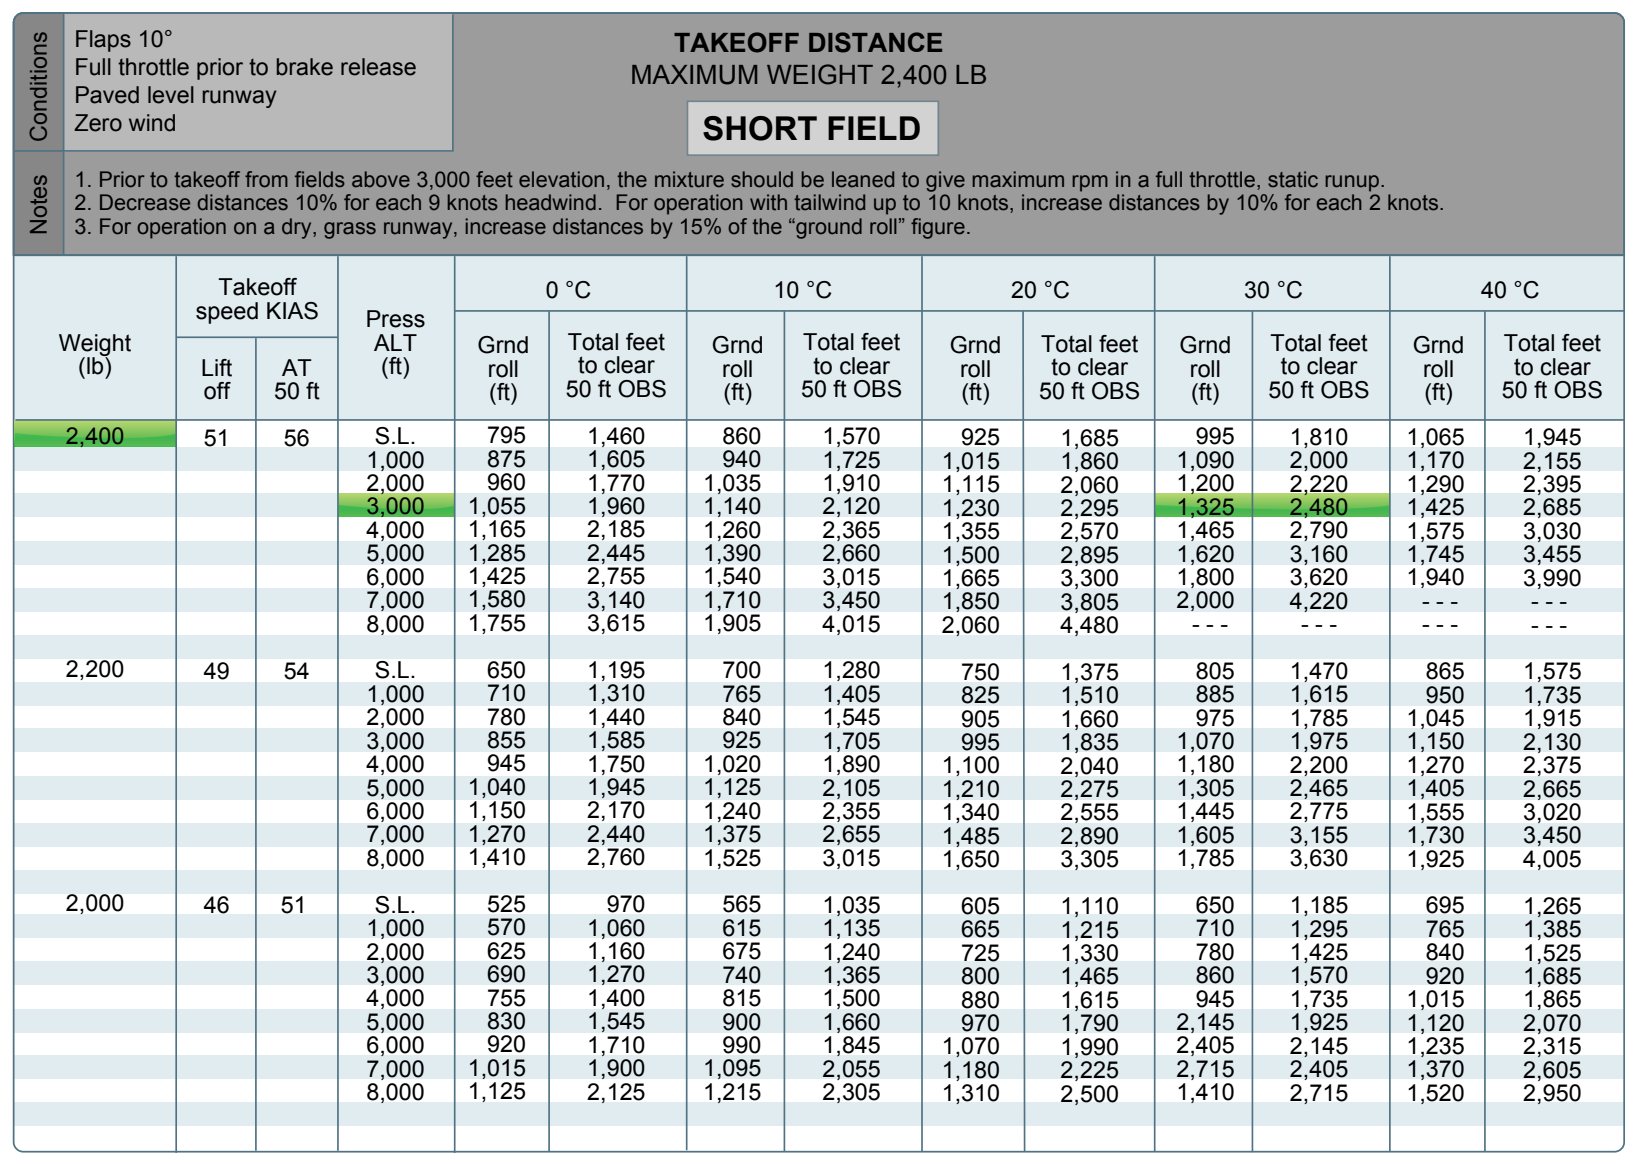
Refer to Figure 11-24. This chart is an example of a takeoff distance table for short-field takeoffs. For this table, first find the takeoff weight. Once at 2,400 pounds, begin reading from left to right across the table. The takeoff speed is in the second column and, in the third column under pressure altitude, find the pressure altitude of 3,000 feet. Carefully follow that line to the right until it is under the correct temperature column of 30 °C. The ground roll total reads 1,325 feet and the total required to clear a 50 foot obstacle is 2,480 feet. At this point, there is an 18 knot headwind. According to the notes section under point number two, decrease the distances by ten percent for each 9 knots of headwind. With an 18 knot headwind, it is necessary to decrease the distance by 20 percent. Multiply 1,325 feet by 20 percent (1,325 ×.20 = 265), subtract the product from the total distance (1,325 - 265 = 1,060). Repeat this process for the total distance over a 50 foot obstacle. The ground roll distance is 1,060 feet and the total distance over a 50 foot obstacle is 1,984 feet.
Climb and Cruise Charts
Climb and cruise chart information is based on actual flight tests conducted in an aircraft of the same type. This information is extremely useful when planning a cross-country flight to predict the performance and fuel consumption of the aircraft. Manufacturers produce several different charts for climb and cruise performance. These charts include everything from fuel, time, and distance to climb to best power setting during cruise to cruise range performance.
The first chart to check for climb performance is a fuel, time, and distance-to-climb chart. This chart gives the fuel amount used during the climb, the time it takes to accomplish the climb, and the ground distance that is covered during the climb. To use this chart, obtain the information for the departing airport and for the cruise altitude. Using
based on the information provided.
Sample Problem 4 Departing Airport Pressure Altitude.................6,000 feet Departing Airport OAT............................................25 °C Cruise Pressure Altitude..................................10,000 feet Cruise OAT..............................................................10 °C
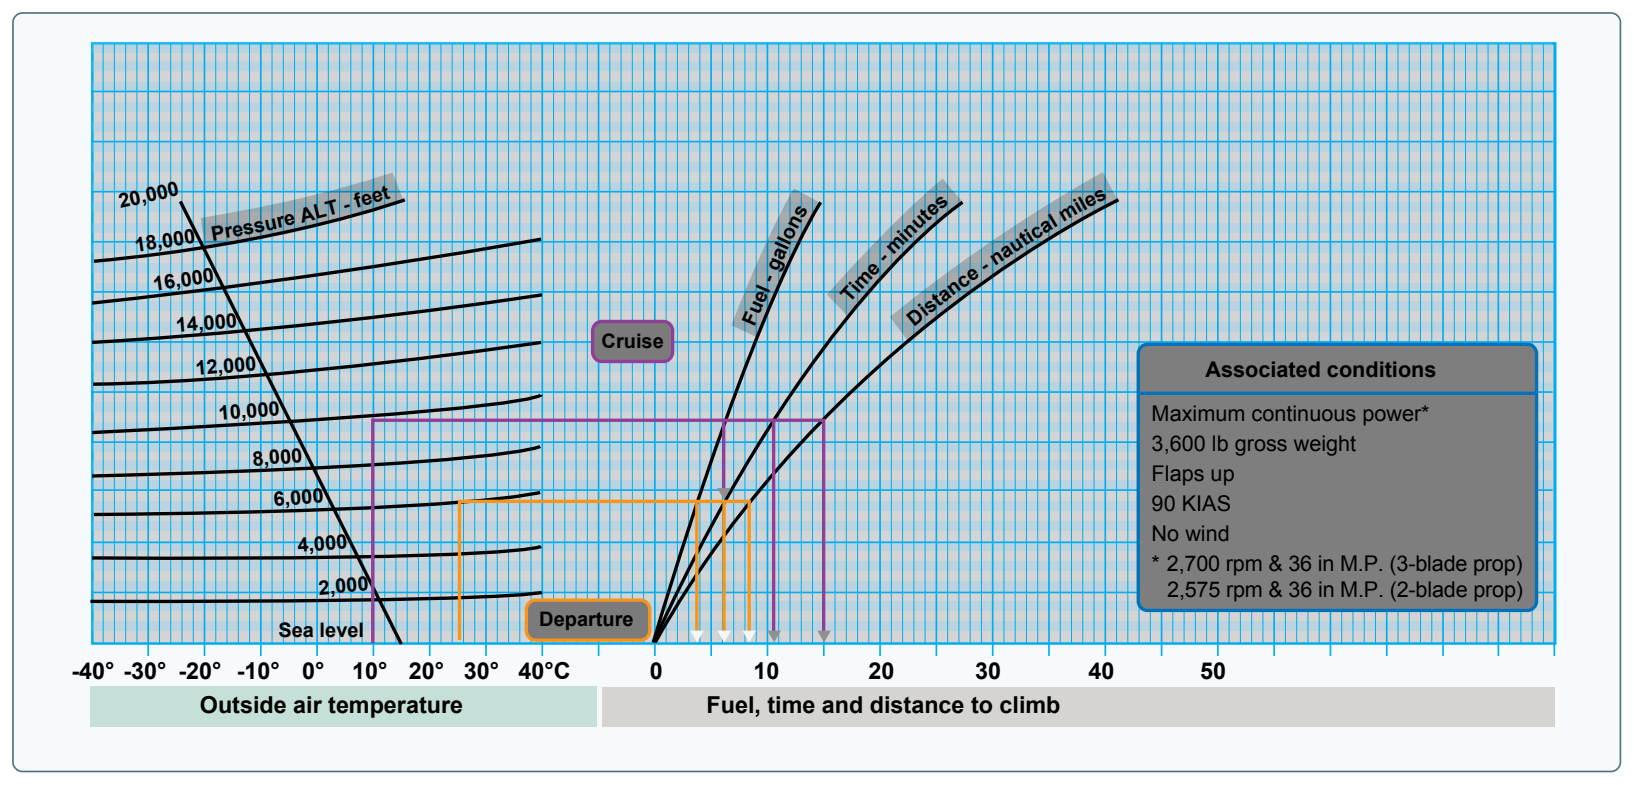
First, find the information for the departing airport. Find the OAT for the departing airport along the bottom, left side of the graph. Follow the line from 25 °C straight up until it intersects the line corresponding to the pressure altitude of 6,000 feet. Continue this line straight across until it intersects all three lines for fuel, time, and distance. Draw a line straight down from the intersection of altitude and fuel, altitude and time, and a third line at altitude and distance. It should read three and one-half gallons of fuel, 6 minutes of time, and nine NM. Next, repeat the steps to find the information for the cruise altitude. It should read six gallons of fuel, 10.5 minutes of time, and 15 NM. Take each set of numbers for fuel, time, and distance and subtract them from one another (6.0 - 3.5 = 2.5 gallons of fuel). It takes two and one-half gallons of fuel and 4 minutes of time to climb to 10,000 feet. During that climb, the distance covered is six NM. Remember, according to the notes at the top of the chart, these numbers do not take into account wind, and it is assumed maximum continuous power is being used.
The next example is a fuel, time, and distance-to-climb table. For this table, use the same basic criteria as for the previous chart. However, it is necessary to figure the information in a different manner. Refer to Figure 11-26 to work the following sample problem.
Sample Problem 5 Departing Airport Pressure Altitude..................Sea level Departing Airport OAT............................................22 °C Cruise Pressure Altitude....................................8,000 feet Takeoff Weight.............................................3,400 pounds To begin, find the given weight of 3,400 in the first column of the chart. Move across to the pressure altitude column to find the sea level altitude numbers. At sea level, the numbers read zero. Next, read the line that corresponds with the cruising altitude of 8,000 feet. Normally, a pilot would subtract these
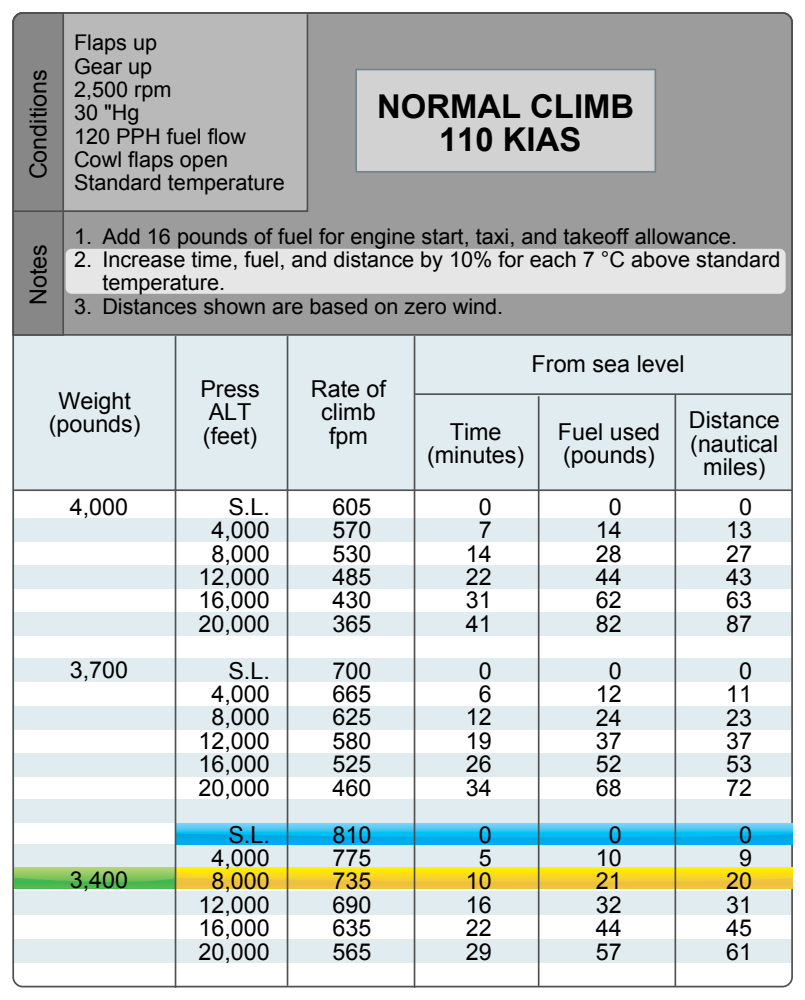
two sets of numbers from one another, but given the fact that the numbers read zero at sea level, it is known that the time to climb from sea level to 8,000 feet is 10 minutes. It is also known that 21 pounds of fuel is used and 20 NM is covered during the climb. However, the temperature is 22 °C, which is 7° above the standard temperature of 15 °C. The notes section of this chart indicate that the findings must be increased by ten percent for each 7° above standard. Multiply the findings by ten percent or.10 (10 ×.10 = 1, 1 + 10 = 11 minutes). After accounting for the additional ten percent, the findings should read 11 minutes, 23.1 pounds of fuel, and 22 NM. Notice that the fuel is reported in pounds of fuel, not gallons. Aviation fuel weighs six pounds per gallon, so 23.1 pounds of fuel is equal to 3.85 gallons of fuel (23.1 ÷ 6 = 3.85).
The next example is a cruise and range performance chart. This type of table is designed to give TAS, fuel consumption, endurance in hours, and range in miles at specific cruise configurations. Use Figure 11-27 to determine the cruise and range performance under the given conditions.
Sample Problem 6 Pressure Altitude...............................................5,000 feet RPM..................................................................2,400 rpm Fuel Carrying Capacity..................38 gallons, no reserve
Find 5,000 feet pressure altitude in the first column on the left side of the table. Next, find the correct rpm of 2,400 in the second column. Follow that line straight across and read the TAS of 116 mph and a fuel burn rate of 6.9 gallons per hour. As per the example, the aircraft is equipped with a fuel carrying capacity of 38 gallons. Under this column, read that the endurance in hours is 5.5 hours and the range in miles is 635 miles.
Cruise power setting tables are useful when planning cross-country flights. The table gives the correct cruise power settings, as well as the fuel flow and airspeed performance numbers at that altitude and airspeed.
Sample Problem 7 Pressure Altitude at Cruise................................6,000 feet OAT..................................................36 °F above standard
Refer to Figure 11-28 for this sample problem. First, locate the pressure altitude of 6,000 feet on the far left side of the table. Follow that line across to the far right side of the table under the 20 °C (or 36 °F) column. At 6,000 feet, the rpm setting of 2,450 will maintain 65 percent continuous power at 21.0 "Hg with a fuel flow rate of 11.5 gallons per hour and airspeed of 161 knots.